Have you ever asked Copilot to do something in Excel and thought, “That’s not really what I wanted”?
The result might work perfectly well. But the formulas are not the ones you would choose, the chart needs reformatting, and you are left making the same adjustments you always make.
The problem is that Copilot does not know your preferences yet. Personalization lets you give it guidelines for how you work, from formula choices to chart styling and naming conventions.
I tested the same reporting task twice, using the same data and the same prompt. The first attempt used no personalization. The second used saved instructions. The difference was not just cosmetic: Copilot changed how it built the summary, too.
What You'll Learn
- Copilot personalization saves your preferences for formulas, formatting, charts, and naming conventions.
- Saved instructions can change the approach Copilot takes without changing your task prompt.
- Personalization follows your account, while workbook rules stay attached to the workbook.
- Review Copilot’s proposed approach and finished output, because instructions may not be followed completely.
The Starting Point: A Working Report with Generic Defaults
My example uses a sales table named tblData and an existing worksheet named Report. The Report sheet already has a region drop-down in cell C3.
I asked Copilot to complete these actions:
- Use tblData to create a summary starting in cell B6 on the Report sheet.
- Show total revenue by product for the region selected in C3.
- Create a column chart on the same sheet.
- Explain its proposed approach and ask for approval before making changes.
That last instruction is useful. Even in edit mode, you can ask Copilot to pause before executing. This gives you an opportunity to check its proposed method rather than discovering the approach after the workbook has changed.
What Copilot chose without personalization
With no custom instructions saved, Copilot proposed a live summary using SUMIFS. It would use the region in C3 as a criterion, create the chart, and format the values.
After I approved the plan, it produced a summary with fixed product names in the first column and SUMIFS formulas in the second. Changing the region drop-down to North updated the revenue figures and the chart.
So, did it work? Absolutely. SUMIFS is designed to sum values that meet multiple criteria, so it is a reasonable choice for revenue filtered by product and region.
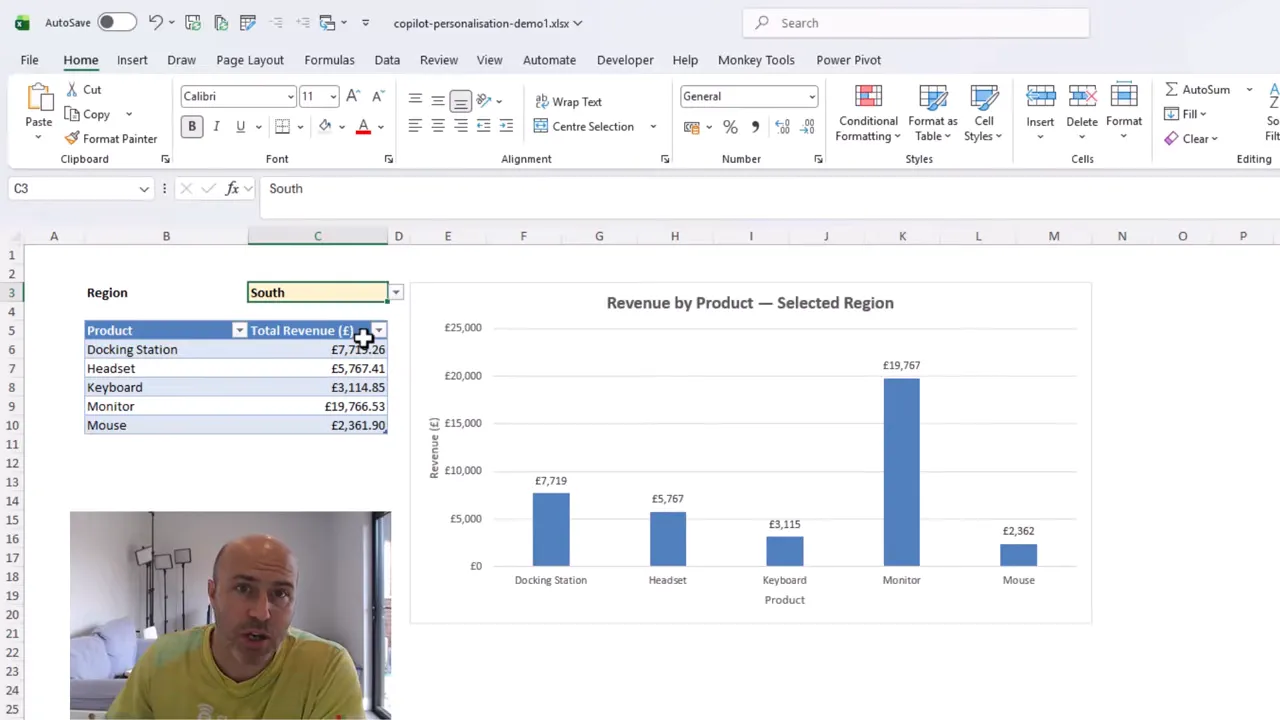
The chart, however, was fairly standard. It had blue columns, axis titles, gridlines, and data labels alongside the vertical axis labels. There was more labeling than I wanted.
It was a good starting point, but it was not how I would normally build and present this report. That is where personalization makes a difference.
Where to Find Copilot Personalization in Excel
You can access the setting directly from the Copilot pane:
- Open the ellipsis menu near the top of the Copilot pane.
- Select Personalization.
- Enter your preferences in the Customize Copilot window.
- Select Save.
Think of these as your standing guidelines. Your prompt explains the current task; personalization explains how you generally want Copilot to carry out that sort of work.
This is a big step forward. To get the most from Copilot, you need to be able to steer it toward your working methods, not keep correcting its defaults.
The same principle applies if you use Claude or ChatGPT with Excel. Those tools also offer ways to provide ongoing guidance, commonly described as instructions.
What to Put in Your Custom Instructions
Your settings should reflect your preferences. Mine cover formulas, formatting, charts, and PivotTables, although the PivotTable instructions do not affect this particular task.
For the revenue report, these were the important guidelines.
Choose the summary formulas you prefer
I instructed Copilot to prefer GROUPBY or PIVOTBY rather than SUMIFS when producing summary tables.
For this task, that points Copilot toward a single GROUPBY formula instead of a fixed list of products with a separate SUMIFS calculation for each row. The grouping, totals, and regional filtering can be handled within that formula.
This is a preference about how to build the report, not a claim that SUMIFS is wrong. If you prefer a different approach, your instructions should say so.
If those functions are new to you, my GROUPBY and PIVOTBY walkthrough explains them in more detail.
Make formula cells easy to identify
I also asked Copilot to apply a light gray fill to cells containing formulas.
That is a simple formatting convention, but it helps make the calculation cells recognizable. More importantly, it is a convention I should not need to repeat in every reporting prompt.
Set your chart defaults
For column charts, I specified the following preferences:
- Use a meaningful, bold chart title.
- Use dark purple columns.
- Remove the chart outline and gridlines.
- Remove axis titles and data labels.
- Sort the values in descending order.
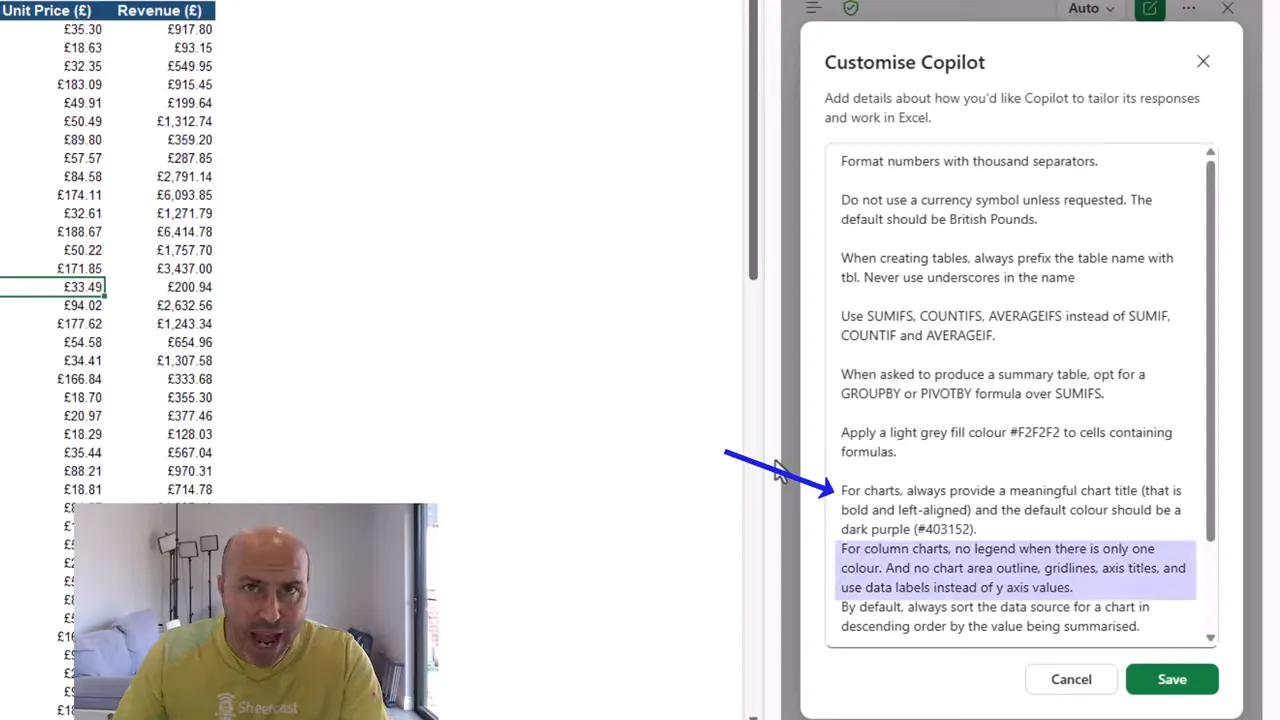
These are the kinds of repeated adjustments that personalization can save you from making. It can also improve consistency across the reports you ask Copilot to create.
Personalization Follows You, Not the Workbook
There is an important distinction here: personalization is tied to your account. It follows your use of Excel rather than belonging to the workbook.
Copilot also has a separate workbook-level feature known as a .rules sheet. That is attached to the workbook.
- Personalization: your own working preferences, associated with your account.
- Workbook rules: guidance attached to a particular workbook.
Keep that difference in mind when deciding where a guideline belongs. Your general formula and styling preferences are different from rules intended for one specific file.
The Same Prompt After Personalization
After saving my settings, I submitted exactly the same reporting request again. I did not add the formula or chart preferences to the prompt. They were already saved in personalization.
Once again, Copilot paused to explain its approach before proceeding. This time, the plan reflected my instructions:
- Place a single GROUPBY formula in Report!B6.
- Include the region filter within the formula.
- Sort the revenue from highest to lowest.
- Apply the light gray formula-cell fill.
- Create a dark purple column chart, with no legend, gridlines, or axis titles.
That is a substantial change from the first attempt. Instead of fixed product labels and multiple SUMIFS formulas, Copilot proposed one formula to generate the summary.
Check the result, not just the plan
After approving the changes, I checked the worksheet. The formula cell had the gray fill, and selecting it confirmed that Copilot had used GROUPBY.
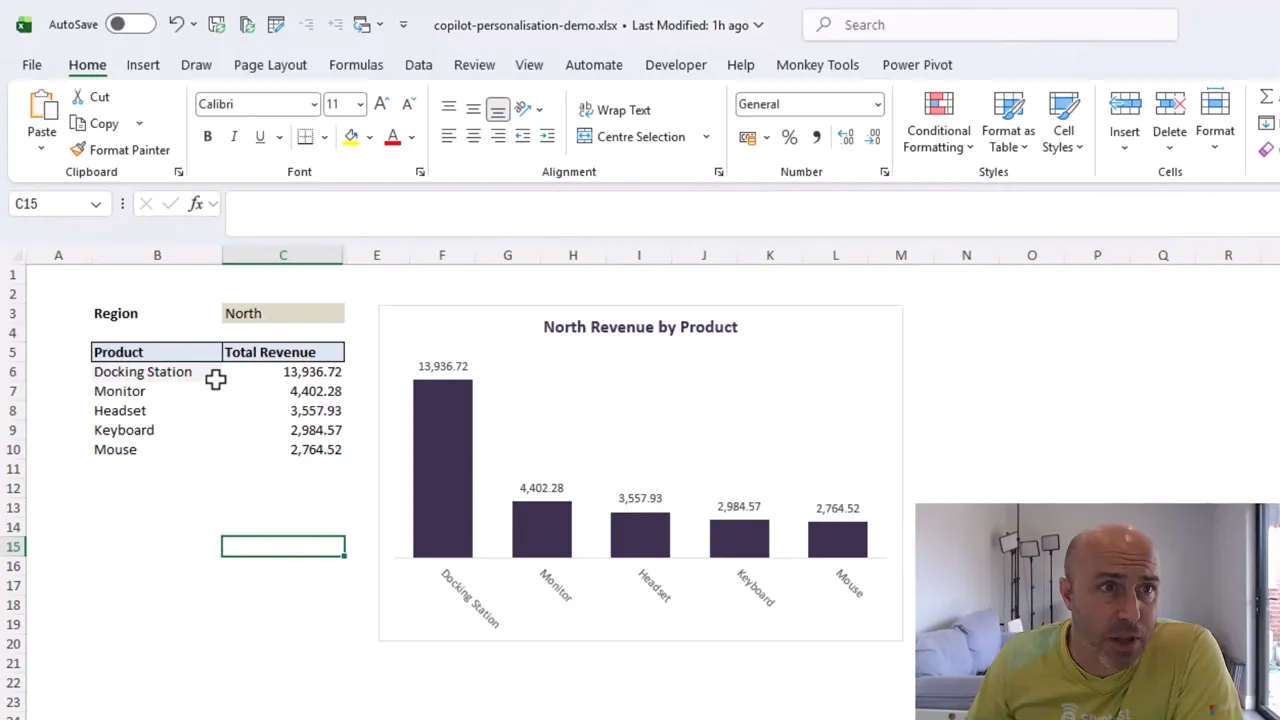
The chart also had the dark purple columns and descending order I requested, along with several of the other formatting changes.
It was not completely finished. Some chart touch-ups were still needed, and data labels remained visible despite my instruction to remove them. Personalization gives Copilot guidance, not a guarantee that every detail will be followed. You still need to inspect the output.
But the result was much closer to how I wanted to work, without making the task prompt any longer.
Start with the Defaults You Keep Correcting
You do not need an enormous set of instructions to make this useful. Start with the preferences you apply repeatedly:
- Prefer XLOOKUP over VLOOKUP.
- Prefer GROUPBY over multiple SUMIFS formulas for summaries.
- Prefix Excel table names with tbl.
- Specify your preferred PivotTable labeling conventions.
- Set consistent formula-cell formatting and chart styles.
The goal is not to use my settings. It is to make Copilot understand yours.
If you regularly correct the same formula choices, table names, or chart formatting, those are strong candidates for personalization. Set those guidelines once, keep checking the results, and give Copilot a much better starting point for the way you work.


